

In patients with gBRCAm, HER2-negative mBC who have been treated with chemotherapy in the neoadjuvant, adjuvant, or metastatic setting and endocrine therapy, if appropriate
LYNPARZA significantly improved PFS vs physician's choice of chemotherapy in the OlympiAD trial1,2*
Primary endpoint: progression-free survival1,2
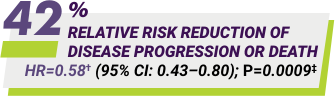
Median PFS: 7.0 months with LYNPARZA vs 4.2 months with chemotherapy
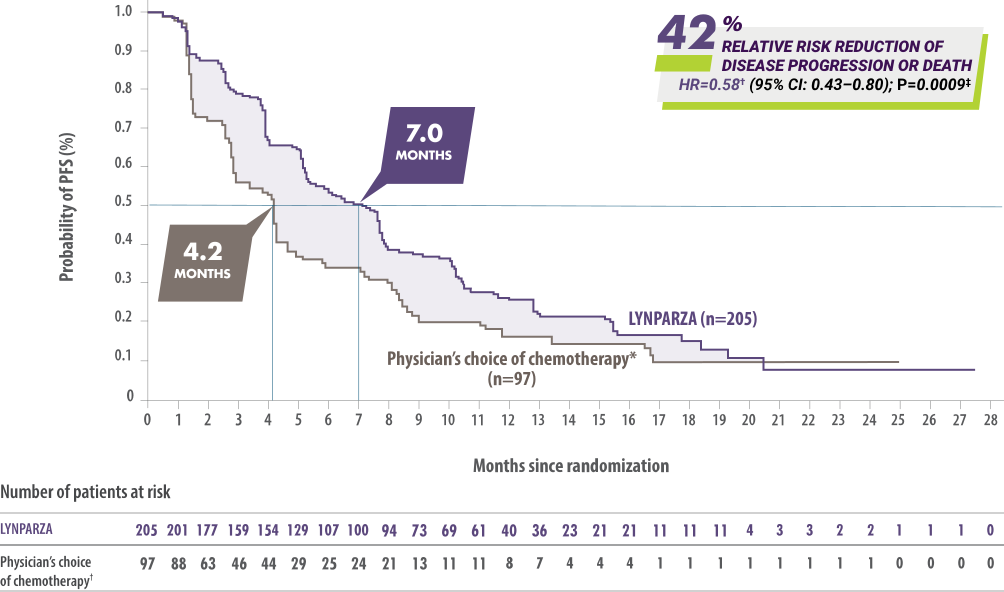
Events, n (%): 163/205 (80) with LYNPARZA and 71/97 (73) with physician's choice of chemotherapy*
PFS at 12 months2
- 25.9% of patients treated with LYNPARZA and 15.0% of patients treated with chemotherapy*
The analysis at 12 months is based on Kaplan–Meier estimates and is descriptive only; the OlympiAD trial was not designed to assess a statistical difference between treatment groups at this time point.2
*Physician's choice of chemotherapy (capecitabine, eribulin, or vinorelbine).1,2
†Hazard ratio is derived from a stratified log-rank test, stratified by ER, PgR-negative vs ER and/or PgR-positive and prior chemotherapy (yes vs no).1
‡For PFS, P value (2-sided) was compared with 0.05.1
Study Design
OlympiAD was designed to evaluate LYNPARZA in certain patients with gBRCAm,* HER2-negative metastatic breast cancer
OlympiAD was a phase 3, open-label, randomized, controlled, multicenter study
OlympiAD studied the efficacy and safety of LYNPARZA vs placebo
- Germline BRCA-mutated HER2-negative metastatic breast cancer, including patients with TNBC or HR-positive breast cancer
- All patients in the neoadjuvant, adjuvant, or metastatic setting received anthracycline (unless contraindicated), a taxane, and ≤2 lines of prior chemotherapy for mBC
- Patients with HR-positive disease must have progressed on at least 1 endocrine therapy (adjuvant or metastatic), or been deemed inappropriate for endocrine therapy by treating physician
- Patients treated with prior platinum-based chemotherapy: no evidence of disease progression in the metastatic setting during platinum-based treatment; in the neoadjuvant or adjuvant setting, ≥12 months must have passed since the last dose
- Randomization was stratified by prior chemotherapy regimens for mBC, HR status, and prior platinum-based chemotherapy
- Patients (N=302) were randomized 2:1 to receive either LYNPARZA tablets 300 mg orally BID (n=205) or physician’s choice of chemotherapy† (n=97)
- Treatment was continued until disease progression or unacceptable toxicity
- The primary endpoint was PFS (BICR-assessed per RECIST v1.1). Select pre-specified secondary endpoints were initial analyses of ORR in patients with measurable disease (BICR-assessed) and overall survival
- Approximately 29% of patients received LYNPARZA as their first treatment for mBC
- Approximately 71% of patients received LYNPARZA as their second or later treatment for mBC
*Select patients for this indication based on an FDA-approved companion diagnostic for LYNPARZA.1
†Physician's choice of chemotherapy (capecitabine, eribulin, or vinorelbine).1,2
LYNPARZA more than doubled objective response rate (ORR) (52% vs 23%) vs physician’s choice of chemotherapy1*
Prespecified secondary endpoint, initial analysis: objective response rate (ORR) in patients with measurable disease (BICR-assessed)1
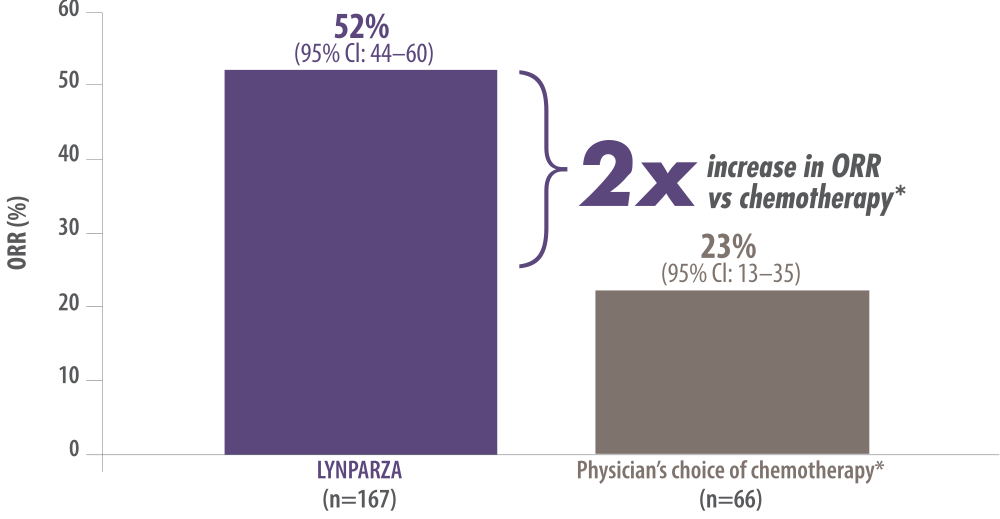
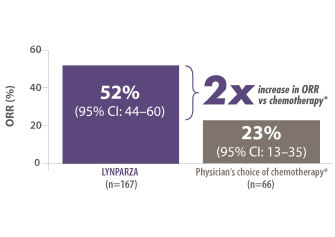
- ORR was a prespecified secondary endpoint. The OlympiAD trial was not powered to assess statistical difference in ORR and median duration of response between treatment groups2
- The confirmed complete response rate was 7.8% for LYNPARZA and 1.5% for the chemotherapy arm1*
- The median duration of response was 6.4 months for LYNPARZA and 7.1 months for the chemotherapy arm2*
- Time of data cutoff for the initial analysis was December 9, 20162
*Physician's choice of chemotherapy (capecitabine, eribulin, or vinorelbine).1,2
Response based on confirmed responses.1
ORR=CR+PR based on blinded independent central review, according to modified RECIST, version 1.1.2
Follow-up analysis: median duration of response reported in patients who responded (investigator-assessed)3
- Median duration of response was 6.9 months in the 95 patients with a response in the LYNPARZA arm and 4.5 months in the 16 patients with a response in the chemotherapy arm.
- DoR was exploratory and was not a randomized comparison. Results should be interpreted with caution.
- Investigator-assessed ORR was recorded in 95 patients (57.6%) in the LYNPARZA arm (n=165) and 16 patients (22.2%) in the chemotherapy arm (n=72)3*
- Time of data cutoff for the follow-up analysis was September 25, 20173
Median DoR is based on the final analysis using investigator-assessed ORR.3
*Physician's choice of chemotherapy (capecitabine, eribulin, or vinorelbine).1,2
Prespecified secondary endpoint: Overall survival
Median OS in the total study population was 19.3 months with LYNPARZA and 17.1 months with physician’s choice of chemotherapy. HR=0.90 (95% CI: 0.66–1.23). OS did not achieve statistical significance. OlympiAD was not powered to show statistical significance in OS for LYNPARZA monotherapy vs chemotherapy.2,3
In OlympiAD
Exploratory subgroup analyses: PFS and OS results across patient subgroups defined by study stratification factors1-4
Tables show outcomes in prespecified subgroups2,3,5
| No prior chemotherapy for mBC (1L) | Prior chemotherapy for mBC (2L+)* | |||
|---|---|---|---|---|
| LYNPARZA (n=59) |
Physician’s choice of chemotherapy† (n=28) |
LYNPARZA (n=146) |
Physician’s choice of chemotherapy† (n=69) |
|
| Median PFS‡ (months) |
7.7 | 3.9 | 7.0 | 4.2 |
| Hazard ratio (95% CI) |
0.56 (0.34–0.98) | 0.65 (0.47–0.91) | ||
| Median OS§ (months) |
22.6 | 14.7 | 18.8 | 17.2 |
| Hazard ratio (95% CI) |
0.51 (0.29–0.90) | 1.13 (0.79–1.64) | ||
| No prior chemotherapy for mBC (1L) | ||
|---|---|---|
| LYNPARZA (n=59) |
Physician’s choice of chemotherapy† (n=28) |
|
| Median PFS‡ (months) |
7.7 | 3.9 |
| Hazard ratio (95% CI) |
0.56 (0.34–0.98) | |
| Median OS§ (months) |
22.6 | 14.7 |
| Hazard ratio (95% CI) |
0.51 (0.29–0.90) | |
| Prior chemotherapy for mBC (2L+)* | ||
|---|---|---|
| LYNPARZA (n=146) |
Physician’s choice of chemotherapy† (n=69) |
|
| Median PFS† (months) |
7.0 | 4.2 |
| Hazard ratio (95% CI) |
0.65 (0.47–0.91) | |
| Median OS§ (months) |
18.8 | 17.2 |
| Hazard ratio (95% CI) |
1.13 (0.79–1.64) | |
| HR+ mBC | TNBC | |||
|---|---|---|---|---|
| LYNPARZA (n=103) |
Physician’s choice of chemotherapy† (n=49) |
LYNPARZA (n=102) |
Physician’s choice of chemotherapy† (n=48) |
|
| Median PFS‡ (months) |
8.3 | 5.1 | 5.6 | 2.9 |
| Hazard ratio (95% CI) |
0.82 (0.55–1.26) | 0.43 (0.29–0.63) | ||
| Median OS§ (months) |
21.8 | 21.3 | 17.4 | 14.9 |
| Hazard ratio (95% CI) |
0.86 (0.55–1.36) | 0.93 (0.62–1.43) | ||
| HR+ mBC | ||
|---|---|---|
| LYNPARZA (n=103) |
Physician’s choice of chemotherapy† (n=49) |
|
| Median PFS‡ (months) |
8.3 | 5.1 |
| Hazard ratio (95% CI) |
0.82 (0.55–1.26) | |
| Median OS§ (months) |
21.8 | 21.3 |
| Hazard ratio (95% CI) |
0.86 (0.55–1.36) | |
| TNBC | ||
|---|---|---|
| LYNPARZA (n=102) |
Physician’s choice of chemotherapy† (n=48) |
|
| Median PFS‡ (months) |
5.6 | 2.9 |
| Hazard ratio (95% CI) |
0.43 (0.29–0.63) | |
| Median OS§ (months) |
17.4 | 14.9 |
| Hazard ratio (95% CI) |
0.93 (0.62–1.43) | |
| No prior platinum-based chemotherapy | Prior platinum-based chemotherapy | |||
|---|---|---|---|---|
| LYNPARZA (n=145) |
Physician’s choice of chemotherapy† (n=71) |
LYNPARZA (n=60) |
Physician’s choice of chemotherapy† (n=26) |
|
| Median PFS‡ (months) |
8.3 | 4.2 | 4.2 | 4.2 |
| Hazard ratio (95% CI) |
0.60 (0.43–0.84) | 0.67 (0.41–1.14) | ||
| Median OS§ (months) |
20.3 | 19.6 | 17.2 | 13.3 |
| Hazard ratio (95% CI) |
0.91 (0.64–1.33) | 0.83 (0.49–1.45) | ||
| No prior platinum-based chemotherapy |
||
|---|---|---|
| LYNPARZA (n=145) |
Physician’s choice of chemotherapy† (n=71) |
|
| Median PFS‡ (months) |
8.3 | 4.2 |
| Hazard ratio (95% CI) |
0.60 (0.43–0.84) | |
| Median OS§ (months) |
20.3 | 19.6 |
| Hazard ratio (95% CI) |
0.91 (0.64–1.33) | |
| Prior platinum-based chemotherapy |
||
|---|---|---|
| LYNPARZA (n=60) |
Physician’s choice of chemotherapy† (n=26) |
|
| Median PFS‡ (months) |
4.2 | 4.2 |
| Hazard ratio (95% CI) |
0.67 (0.41–1.14) | |
| Median OS§ (months) |
17.2 | 13.3 |
| Hazard ratio (95% CI) |
0.83 (0.49–1.45) | |
- OlympiAD was not powered to detect differences in the treatment effect between the arms within these stratification factors; therefore, results from these exploratory analyses should be interpreted with caution because of the modest patient numbers and baseline imbalances2
- In OlympiAD, previous use of chemotherapy for metastatic disease, HR status, and previous use of platinum-based therapy were the primary protocol-specified stratification factors1,2
- These subgroups of the full analysis set were analyzed for PFS and OS2,5
- In this exploratory subgroup analysis, time of data cutoff for median PFS was December 9, 2016, and time of data cutoff for median OS was September 25, 20172,5
*2L+ includes the second line or later lines of treatment.2
†Physician’s choice of chemotherapy (capecitabine, eribulin, or vinorelbine).1,2
‡An exploratory analysis of investigator-assessed PFS was consistent with the BICR-assessed PFS results.1
§OS stratification factors were prespecified but not alpha controlled.4,6
In OlympiAD
Exploratory subgroup analysis: ORR results across patient subgroups defined as stratification factors7
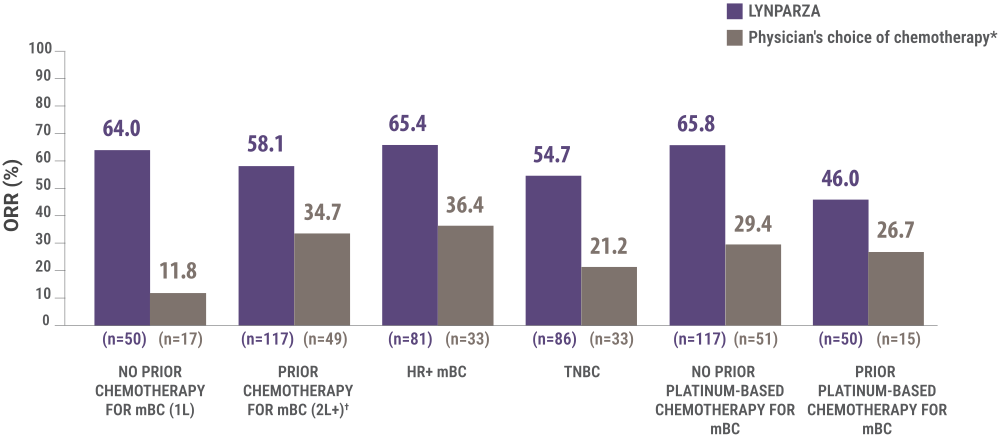
- OlympiAD was not powered to detect differences in the treatment effect between these subgroups; therefore, results from these exploratory analyses should be interpreted with caution because of the modest patient numbers and baseline imbalances2
- In OlympiAD, previous use of chemotherapy for metastatic disease, HR status, and previous use of platinum-based therapy were the primary protocol-specified stratification factors2
- These subgroups of the full analysis set were analyzed for ORR2
- Information for these parameters was obtained locally at the time of trial registration with the use of an interactive voice or web-response system2
Response was assessed by BICR in patients with measurable disease.7
*Physician's choice of chemotherapy (capecitabine, eribulin, or vinorelbine).1,2
†2L+ includes the second line or later lines of treatment.2
In OlympiAD
Exploratory subgroup analysis: PFS and ORR results in patients with brain/CNS or visceral metastases8
| Brain/CNS | Liver | Lung/Pleura | ||||
|---|---|---|---|---|---|---|
| LYNPARZA (n=18) |
Physician's choice of chemotherapy* (n=8) |
LYNPARZA (n=79) |
Physician's choice of chemotherapy* (n=37) |
LYNPARZA (n=117) |
Physician's choice of chemotherapy* (n=54) |
|
| Median PFS† (months) | 8.3 | 2.8 | 5.6 | 2.9 | 5.7 | 3.0 |
| Hazard ratio (95% CI) | 0.51 (0.19-1.58) |
0.73 (0.48-1.15) |
0.59 (0.41-0.88) |
|||
| LYNPARZA (n=17) |
Physician's choice of chemotherapy* (n=5) |
LYNPARZA (n=74) |
Physician's choice of chemotherapy* (n=31) |
LYNPARZA (n=103) |
Physician's choice of chemotherapy* (n=36) |
|
|---|---|---|---|---|---|---|
| ORR (%) | 64.7 | 20.0 | 59.5 | 25.8 | 61.2 | 22.2 |
| Brain/CNS | ||
|---|---|---|
| LYNPARZA (n=18) |
Physician's choice of chemotherapy* (n=8) |
|
| Median PFS† (months) |
8.3 | 2.8 |
| Hazard ratio (95% CI) |
0.51 (0.19-1.58) |
|
| LYNPARZA (n=17) |
Physician's choice of chemotherapy* (n=5) |
|
|---|---|---|
| ORR (%) | 64.7 | 20.0 |
| Liver | ||
|---|---|---|
| LYNPARZA (n=79) |
Physician's choice of chemotherapy* (n=37) |
|
| Median PFS† (months) |
5.6 | 2.9 |
| Hazard ratio (95% CI) |
0.73 (0.48-1.15) |
|
| LYNPARZA (n=74) |
Physician's choice of chemotherapy* (n=31) |
|
|---|---|---|
| ORR (%) | 59.5 | 25.8 |
| Lung/Pleura | ||
|---|---|---|
| LYNPARZA (n=117) |
Physician's choice of chemotherapy* (n=54) |
|
| Median PFS† (months) |
5.7 | 3.0 |
| Hazard ratio (95% CI) |
0.59 (0.41-0.88) |
|
| LYNPARZA (n=103) |
Physician's choice of chemotherapy* (n=36) |
|
|---|---|---|
| ORR (%) | 61.2 | 22.2 |
- OlympiAD was not powered to detect differences in the treatment effect between these subgroups; therefore, results from these exploratory analyses should be interpreted with caution because of the modest patient numbers and baseline imbalances8
- Although bone metastasis was reported, no formal analysis was conducted on this subgroup2
*Physician's choice of chemotherapy (capecitabine, eribulin, or vinorelbine).1,2
†An exploratory analysis of investigator-assessed PFS was consistent with the BICR-assessed PFS results.1
References
Robson M, Im SA, Senkus E, et al. Olaparib for metastatic breast cancer in patients with a germline BRCA mutation. N Engl J Med. 2017;377(6):523-533.
Data on File, REF-47776. AstraZeneca Pharmaceuticals LP.
Robson ME, Tung N, Conte P, et al. OlympiAD final overall survival and tolerability results: olaparib versus chemotherapy treatment of physician’s choice in patients with a germline BRCA mutation and HER2-negative metastatic breast cancer. Ann Oncol. 2019;30(4):558-566.
LYNPARZA® (olaparib) [prescribing information]. Wilmington, DE: AstraZeneca Pharmaceuticals LP; 2023.
Robson M, Im SA, Senkus E, et al. OlympiAD extended follow-up for overall survival and safety: olaparib versus chemotherapy treatment of physician’s choice in patients with a germline BRCA mutation and HER2-negative metastatic breast cancer. Poster presented at: San Antonio Breast Cancer Symposium; December 10-14, 2019; San Antonio, TX.
Robson ME, Tung N, Conte P, et al. OlympiAD final overall survival and tolerability results: olaparib versus chemotherapy treatment of physician’s choice in patients with a germline BRCA mutation and HER2-negative metastatic breast cancer. Supplementary Appendix. Ann Oncol. 2019;30(4):558-566.
Robson M, Im SA, Senkus E, et al. Olaparib for metastatic breast cancer in patients with a germline BRCA mutation. Supplementary Appendix. N Engl J Med. 2017;377(6):523-533.
Tung NM, Im SA, Senkus-Konefka E, et al. Olaparib versus chemotherapy treatment of physician’s choice in patients with a germline BRCA mutation and HER2-negative metastatic breast cancer (OlympiAD): efficacy in patients with visceral metastases. Poster presented at: 2018 ASCO Annual Meeting; June 1-5, 2018; Chicago, IL.